Exam Topics
- F5CAB3
- F5CAB3.02
- Apply appropriate health monitor
- Determine configured health monitor
- F5CAB3.02
Introduction
In the previous Health Monitor lessons, we explored why health monitors are required and how they determine whether a backend resource is available and able to serve traffic.
In this course, we will move from concepts to configuration and troubleshooting. You will learn how to create health monitors and associate them with nodes, pools, and pool members using both the Configuration Utility (GUI) and TMSH (CLI).
Once a monitor is configured, we will also see how to verify its configuration and operational status, test a monitor before applying it to production traffic, and use BIG-IP information to troubleshoot monitor failures.
Create a Health Monitor
Using the Configuration Utility
To create a custom health monitor, navigate to:
Local Traffic → Monitors
Then click Create.
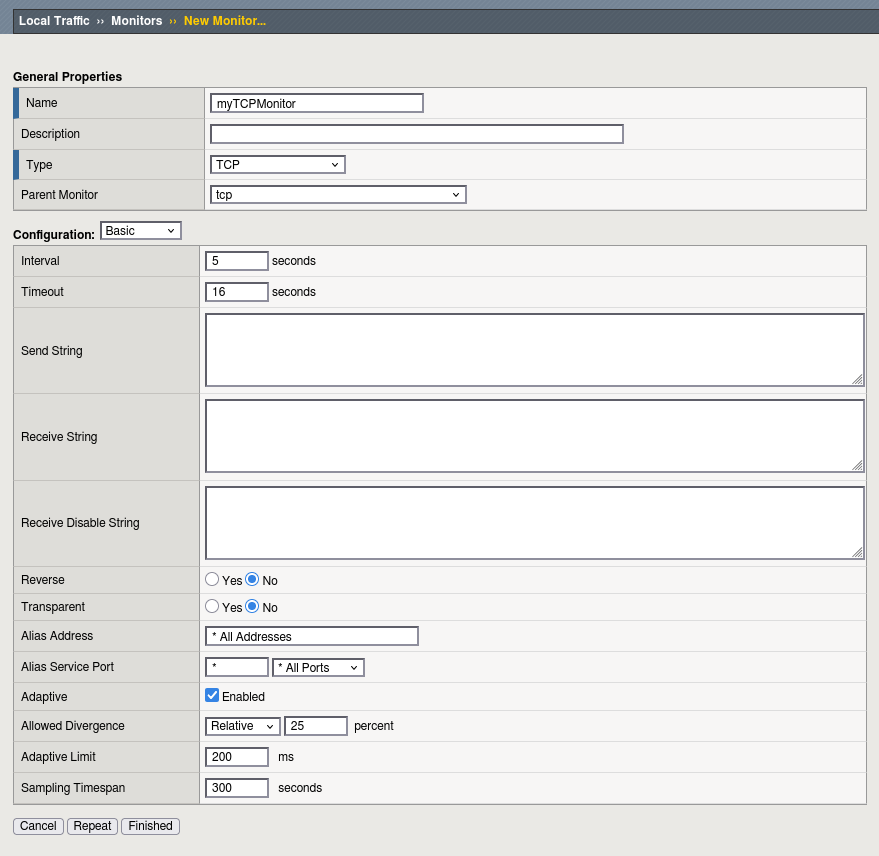
Each custom monitor requires at least:
- Type : Defines how the BIG-IP performs the health check, such as TCP, HTTP, ICMP, or DNS.
- Parent Monitor : Provides the default settings from which the new monitor inherits.
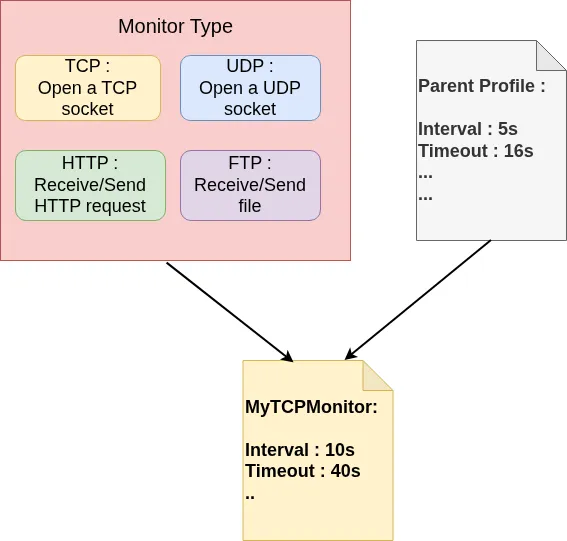
The monitor type determines its behavior, while the parent monitor provides a reusable baseline configuration.
Once the type and parent monitor are selected, you can customize the monitor parameters. For example, you can override the interval, timeout, send string, receive string, or other type-specific settings.
Any value explicitly configured on the custom monitor overrides the corresponding value inherited from the parent monitor.
Apply a Health Monitor
Once a monitor has been created, it can be associated with a BIG-IP resource at different levels:
- Node level
Typically used with simple monitors such as ICMP. The monitor validates the availability of the node itself rather than a specific service. If the node is marked down, pool members associated with that node are also considered unavailable. - Pool Member level
A monitor can be assigned directly to an individual pool member. This provides the highest level of granularity and allows different members of the same pool to use different monitors or monitor combinations. - Pool level
A monitor assigned to a pool is inherited by pool members configured with Inherit from Pool, which is the default behavior when a pool member is created.
This hierarchy provides flexibility: administrators can use a common monitor at the pool level for simple deployments, while overriding it at the pool member level when individual services require different health checks.
Apply a monitor to a node
To apply a monitor directly to a node, open the node configuration and locate the Health Monitors setting.
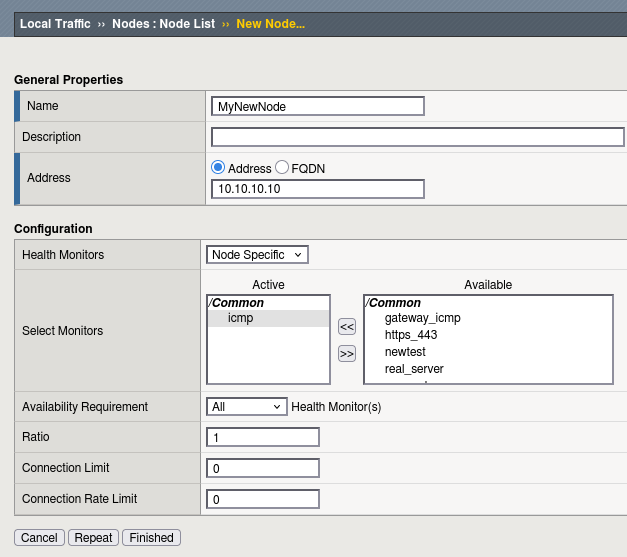
Change the monitoring mode to Node Specific. The Select Monitors field then becomes available, allowing you to assign one or more monitors to the node.
Because the monitor is applied to the node, it evaluates the availability of the server rather than a specific service running on that server.
Apply a monitor to a pool
To apply a monitor to a pool, open the pool configuration and locate the Health Monitors setting.
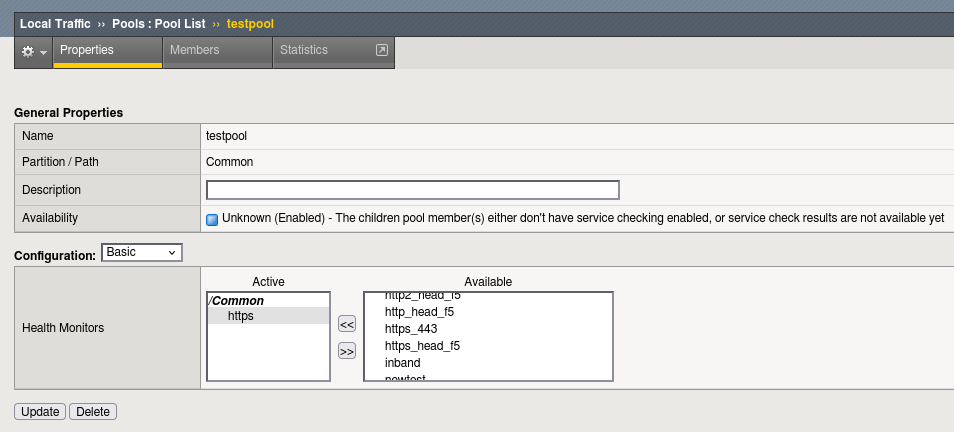
Add one or more monitors to the pool. These monitors are automatically inherited by pool members configured with Inherit from Pool.
This is generally the simplest approach when all members provide the same service and should be monitored in the same way.
Apply a monitor to a pool member
A pool member can inherit the monitor configured at the pool level, but this behavior can be overridden for an individual member.
Open the pool member configuration and change Health Monitors from Inherit from Pool to Member Specific.
The Select Monitors field then allows you to assign one or more monitors directly to that pool member.
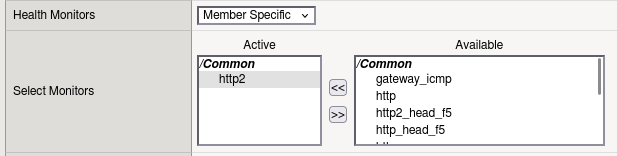 This is useful when one backend server requires a different health check from the other members of the pool.
Configure a Health Monitor Using TMSH
Health monitors can also be created and configured from the command line using TMSH.
Create a Monitor
The general syntax is:
create ltm monitor <type> <monitor-name>
For example, to create a TCP monitor:
create ltm monitor tcp MyTcpMonitor
The monitor can then be customized using the modify command. For example, to change the interval to 15 seconds:
modify ltm monitor tcp MyTcpMonitor interval 15
Parameters can also be specified when the monitor is created.
Common parameters include:
| Parameter Name | Description | Possible value | Example |
|---|---|---|---|
| interval | Frequency between two health check | integer (in second) | interval 15 |
| timeout | The amount of time the BIG-IP waits for a valid response | integer (in second) | timeout 60 |
| time-until-up | Specifies the amount of time in seconds after the first successful response before a resource will be marked up. | integer (in second) | time-until-up 120 |
| destination | Uses the specified alias address and port as the monitor destination instead of the address and port configured on the resource | ip:port, wildcard allowed (*) | destination 192.168.1.1:* |
| transparent | Sends the monitor through the specified object while using the configured alias address as the destination instead of the object’s actual address | enabled / disabled | transparent enabled |
| reverse | Operates the monitor in reverse mode: a successful monitor result marks the resource down, while a failed monitor result marks it up. | enabled / disabled | reverse enabled |
| adaptive | Takes the server’s response time into account in addition to determining whether the resource is up or down. | enabled / disabled | adaptive enabled |
The exact parameters available depend on the monitor type. For example, an HTTP monitor provides HTTP-specific options that are not applicable to an ICMP monitor.
Verify an Applied Monitor
When troubleshooting a configuration, one of the first steps is to determine which monitor is actually applied to the resource.
This is particularly important because a pool member can inherit a pool monitor or override it with its own monitor configuration.
Verify the Pool Configuration
The following command displays the pool configuration:
list ltm pool mypool
For example:
ltm pool mypool {
    members {
        192.168.120.35:http {
            address 192.168.120.35
            monitor http and http2
            session monitor-enabled
            state down
        }
        192.168.150.1:http {
            address 192.168.150.1
            session monitor-enabled
            state up
        }
    }
    monitor manual
}
From this output, you can see that the pool has manual configured as its pool-level monitor.
However, the 192.168.120.35 pool member explicitly overrides the pool monitor with:
monitor http and http2
Therefore:
192.168.150.1inherits the pool monitor manual192.168.120.35uses its own http and http2 monitors
This is an important distinction when troubleshooting, as the monitor displayed at the pool level may not be the monitor actually being used by every pool member.
Display Operational Status
The show command provides a more operational view:
show ltm pool mypool
The output includes information such as:
Status
    Availability           : available
    State                  : enabled
    Reason                 : The pool is available
    Monitor                : manual
    Minimum Active Members : 0
    Priority Groups        : 0/0/0
    Current Active Members : 1
    Available Members     : 1
    Total Members         : 2
This allows you to quickly determine the overall pool availability, the monitor applied at the pool level, and how many members are currently available.
However, the pool-level output does not provide all the details for each individual pool member.
To obtain detailed information about the members, use detail option:
show ltm pool mypool detail
The detailed output allows you to inspect each pool member individually, including its availability, monitor, monitor status, reason for failure, and session state.
For example:
Ltm::Pool Member: 192.168.120.35:80

Status
    Availability   : offline
    State          : enabled
    Reason         : http2: No successful responses received before deadline.
    Monitor        : http and /Common/http2
    Monitor Status : down
    Session Status : enabled
    Pool Name      : uppool
    IP Address     : 192.168.120.35
This output immediately shows that the pool member is offline, that its monitor is down, and that the http2 monitor is responsible for the failed health check.
The output also shows that two monitors are assigned to the pool member: http and http2. Both monitors are therefore evaluated to determine the member
The same approach can be used to inspect nodes:
list ltm node <node-name>
show ltm node <node-name>
This distinction between configuration information (list) and operational information (show) is particularly useful during troubleshooting.
Test a Monitor Before Applying It
Before assigning a newly created monitor to a production pool member, it can be useful to test it independently.
Imagine that you have developed a new monitor designed to provide a more precise health check. If you immediately apply it to a production pool member and the monitor is incorrectly configured, the BIG-IP could incorrectly mark a healthy resource as DOWN.
Testing the monitor first allows you to validate its behavior without changing the availability status of a production pool member.
Using the Configuration Utility
Navigate to:
Local Traffic → Monitors
Select the monitor you want to test and open the Test submenu.
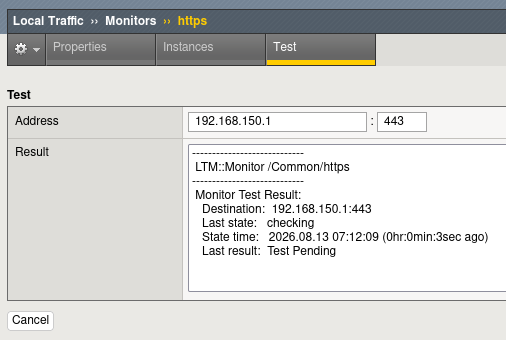
You can specify the destination IP address and port against which the monitor should be tested.
Click Test to execute the monitor and review the result.
Using TMSH
If the monitor test cannot be performed through the Configuration Utility, you can execute it from TMSH.
The general command is:
run ltm monitor destination IPAddress:Port
For example:
run ltm monitor https MyHttpsMonitor destination 192.168.150.2:443
After launching the test, you can review the result with:
show ltm monitor https MyHttpsMonitor test-result
A successful test may return information similar to:
LTM::Monitor /Common/https Monitor Test Result: Destination: 192.168.150.2:443 Last state: up State time: 2026.08.13 05:25:13 Last result: Test Completed (UP) See /var/log/monitors/Common_https-Common_monitor_test-443.log
The test result provides immediate feedback on whether the monitor considers the target UP or DOWN and can also point you toward the monitor log for additional troubleshooting information.
This makes monitor testing particularly useful when developing or troubleshooting custom monitors before applying them to production traffic.
Monitor Logging
We have seen how to verify the monitors applied to a resource and their current status using the list, show, and test commands. In this section, we will move into more advanced troubleshooting by examining the BIG-IP logs.
Review Monitor Logs
The /var/log/ltm log records important LTM events, including changes to the availability status of pool members caused by health monitors.
For example, if a server suddenly stops responding correctly and its monitors fail, an entry similar to the following is recorded:
Aug 13 05:42:02 mybigip.local notice mcpd[7239]: 01070638:5: Pool /Common/uppool member /Common/192.168.120.35:80 monitor status down. [ /Common/test: down; last error: /Common/http: No successful responses received before deadline. @2026/08/13 04:57:53. /Common/http2: No successful responses received before deadline. @2026/08/13 04:57:53. ] [ was down for 0hr:0min:33sec ]
The log entry provides useful information, including:
- The pool and pool member affected
- The monitor status change
- The monitor(s) that failed
- The reason for the failure
- The time of the event
- How long the pool member remained in the previous state
A similar message is generated when the pool member becomes available again:
notice mcpd[2964]: 01070727:5: Pool <Pool_name> member <ServerIP:port> monitor status up. [ <MonitorB_name>: up ] [ was down for <#>hrs:<#>mins:<#>sec ]
This makes
/var/log/ltm
particularly useful when troubleshooting intermittent monitor failures. By reviewing the log entries, you can reconstruct when a resource went down, when it recovered, which monitor caused the status change, and how long the resource remained unavailable.
Enable Detailed Monitor Logging
The standard LTM log provides information about status changes, but it does not record every detail of each monitor probe. For more detailed troubleshooting, you can enable Monitor Logging directly on the monitor configuration.

When enabled, the BIG-IP generates more verbose information about the monitor operation in the dedicated directory:
/var/log/monitors/
Each monitor with logging enabled generates its own log file, allowing you to inspect individual monitor operations and better understand why a health check is succeeding or failing.
Conclusion
In this course, we have seen how to create, apply, verify, and troubleshoot health monitors on the F5 BIG-IP.
We saw that a monitor can be applied at the node, pool, or pool member level. A pool can define a common monitor inherited by all its members, while individual pool members can override the pool-level configuration when more granular monitoring is required.
We also explored how to use TMSH to inspect the monitor configuration with list and verify its operational status with show. Before applying a new monitor to a production resource, the monitor can also be independently tested using either the Configuration Utility or TMSH.
Finally, for more advanced troubleshooting, we saw how to use /var/log/ltm to identify monitor status changes and understand when and why a pool member went up or down. When more detailed information about individual monitor probes is required, Monitor Logging can be enabled, with the resulting logs available under /var/log/monitors/.
Together, these tools provide the complete workflow needed to configure health monitoring, validate its behavior, and troubleshoot monitor-related availability issues.