Exam Topics
- F5CAB2
- F5CAB2.03
- Identify traffic diverted due to status of traffic objects (vs, pool, pool member)
- Identify when connection/rate limits are reached
- F5CAB2.03
Introduction
On an F5 BIG-IP system, many objects are involved in application delivery, such as Virtual Servers, Pools, Pool Members, and Nodes. Each of these objects has a status and availability state that helps determine whether services are operating normally, experiencing issues, or have been intentionally taken offline.
In this article, we will review the different object states and how to quickly identify their status to troubleshoot issues more efficiently.
Network Map of Objects
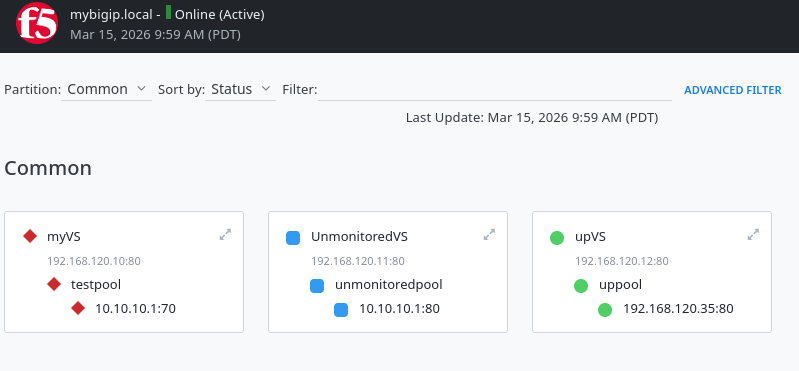
In the Configuration Utility, you can quickly check the status of an object by observing the icon and color displayed next to it.
For a comprehensive overview of all objects and their current status on the BIG-IP, navigate to Local Traffic → Network Map. This view allows you to see the relationships between Virtual Servers, Pools, Pool Members, and Nodes, along with their operational state, in a single visual diagram.
Object status meaning
Objects on an F5 BIG-IP can have multiple states. The first is the monitoring status. By applying health monitors to nodes or pool members, the BIG-IP can determine their real availability. This prevents traffic from being sent to a malfunctioning or unavailable resource.
The second is the administrative status. Even if a monitor reports an object as available, an administrator may want to manually disable it. This is commonly done to temporarily remove a node or pool member from service during maintenance operations.
In the Configuration Utility, the overall object state (monitoring and administrative) is represented by a combination of an icon and a color.
Icon
The icon primarily represents the monitoring status:
-
Circle : Monitor up (resource healthy and available)
-
Diamond : Monitor down (for example, health checks are failing)
-
Square : No monitor configured (resource considered available)
-
Triangle: Resource temporarily unavailable but may become available again (for example, connection limit reached)
Color
The color indicates the administrative status:
-
Black: Resource manually disabled by the administrator
-
Grey: Resource disabled due to a parent object (for example, a disabled pool)
If the administrative status is enabled, the color instead reflects the monitoring state:
-
Green: Monitor up
-
Red: Monitor down
-
Blue: No monitor configured
-
Yellow: Monitor up but resource currently unavailable (for example, reached a limit)
Understanding this icon and color combination allows administrators to quickly assess the health and availability of BIG-IP objects during operations and troubleshooting.
Examples
Here are some common examples to better understand how the icon (monitoring state) and color (administrative state) combine:
Node manually disabled while the monitor is up:
-
Shape: Circle (monitor is up)
-
Color: Black (manually disabled)
-
Result: Black circle
Node enabled but the monitor is failing:
-
Shape: Diamond (monitor down)
-
Color: Red (enabled, but monitor reports failure)
-
Result: Red diamond
Manually disabled object with no monitor configured:
-
Shape: Square (no monitor)
-
Color: Black (manually disabled)
-
Result: Black square
Parent object disabled while the monitor is up:
-
Shape: Circle (monitor is up)
-
Color: Grey (disabled due to a parent object such as a pool)
-
Result: Grey circle
Force offline
As seen previously, the administrative status of an object can be set to enabled or disabled. However, there is a third option called Force Offline, which provides more granular control when removing a resource from service.
What is the difference between Disabled and Force Offline?
When taking a resource out of service, you can choose between Disabled and Force Offline depending on how you want existing and new connections to behave.
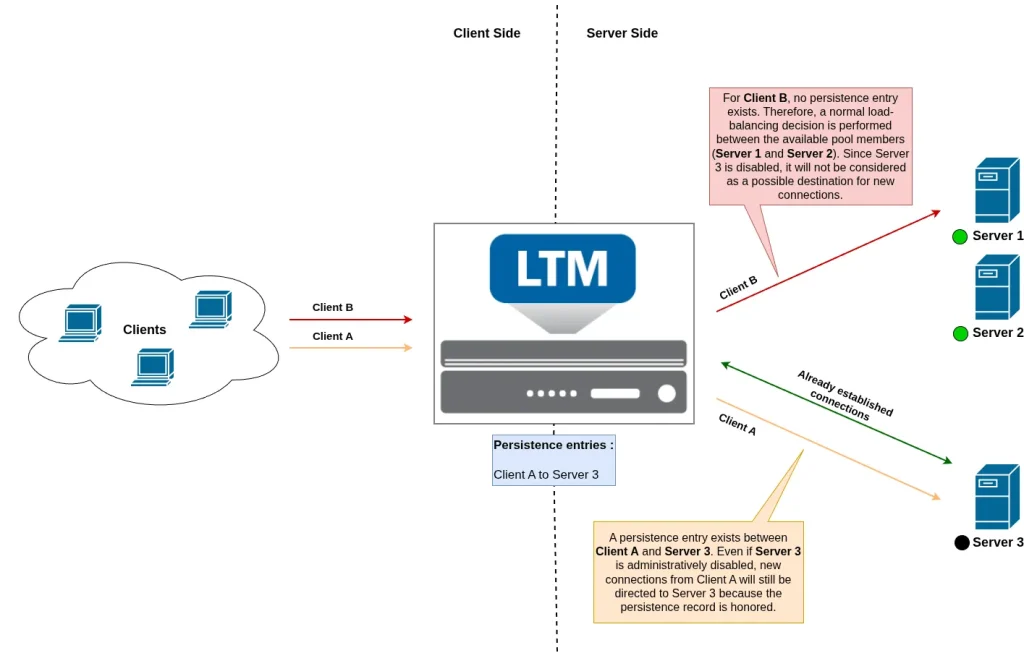
With Disabled:
-
No new load balanced connections are sent to the resource
-
New connections with an existing persistence record are still allowed
-
Existing connections continue normally
For example:
-
A disabled pool member will still accept new connections if they match an existing persistence entry, but new connections without persistence will be sent to another available pool member.
-
A disabled virtual server will also accept new connections that match a persistence record, while new non-persisted connections will be rejected.
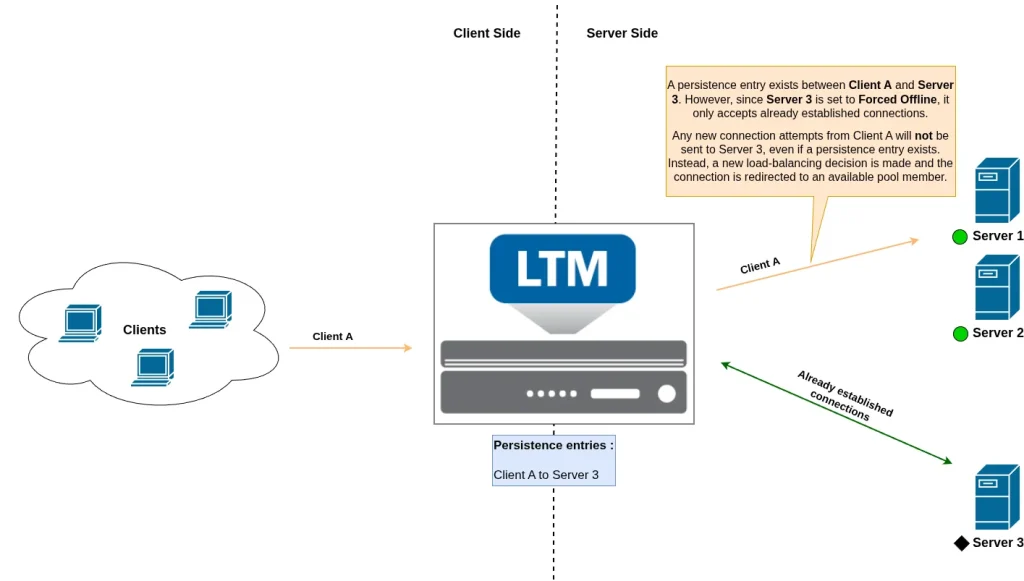
With Force Offline:
-
No new connections are accepted at all, including persisted connections
-
Only already established connections are allowed to continue until they naturally close
For example:
-
A virtual server in Force Offline will not accept any new connections and will only continue serving existing sessions.
-
A pool member in Force Offline will not receive any new connections. Existing connections continue, and new requests are sent to other available pool members if possible.
In both cases (Disabled or Force Offline), existing connections are never immediately terminated. This makes both options useful for maintenance operations. In practice, administrators often place resources in Force Offline and wait for existing connections to drain before performing maintenance.
Icon status of forced offline resources
The icon used for a forced offline resource is a black diamond. This icon is displayed regardless of the actual monitoring status of the object.
Normally, a resource with a healthy monitor would be represented by a circle. However, Force Offline is an exception to this rule. When a resource is forced offline, the administrative state takes visual priority, and the icon no longer reflects the real monitoring status.
This means you cannot determine the actual health status from the icon alone when a resource is forced offline.
Object Status Using the Command Line
We’ve seen how to determine an object’s status in the Configuration Utility by reviewing its icon and color. But what if you don’t have access to the UI and need to check status from the command line, where there are no icons?
An object’s status is represented by two key parameters:
-
Session: This reflects the user-configured mode of the object. It is equivalent to enabling or disabling the object. Possible values include:
-
user-enabledoruser-disabledfor manual configuration -
monitor-enabledwhen a monitor is configured and the object is enabled.
-
-
State: This represents the actual health of the object based on its monitor:
-
upwhen the health check passes -
downwhen the health check fails -
uncheckedwhen no monitor is configured -
user-downfor objects in force offline mode
-
By combining these two parameters, you can determine the equivalent of the icon and color shown in the Web UI.
Examples:
-
A green circle corresponds to
session: monitor-enabledandstate: up. -
A black circle corresponds to
session: user-disabledandstate: up. -
A red diamond corresponds to
session: monitor-enabledandstate: down.
Using this approach, you can interpret object status entirely from the command line, even without access to the Web UI.
Table of states
Prefer a quick reference instead of memorizing every state? The following table summarizes object states, including icon, monitor status, administrative state, connection behavior, and corresponding tmsh values.
| Icon | Monitor status | Administrative status | New connections | Persisted connections | tmsh session | tmsh state |
|---|---|---|---|---|---|---|
| Up | Enabled | Allowed | Allowed | monitor-enabled | up | |
| Up | Disabled (parent) | Disallowed | Allowed | monitor-enabled | up | |
| Up | Disabled (manual) | Disallowed | Allowed | user-disabled | up | |
| No monitor | Enabled | Allowed | Allowed | user-enabled | unchecked | |
| No monitor | Disabled (parent) | Disallowed | Allowed | user-enabled | unchecked | |
| No monitor | Disabled (manual) | Disallowed | Allowed | user-disabled | unchecked | |
| Temporarily unavailable | Enabled | Disallowed | Disallowed | monitor-enabled | unchecked | |
| Temporarily unavailable | Disabled (parent) | Disallowed | Disallowed | monitor-enabled | down | |
| Temporarily unavailable | Disabled (manual) | Disallowed | Disallowed | user-disabled | down | |
| Down | Enabled | Disallowed | Disallowed | monitor-enabled | down | |
| Down | Disabled (parent) | Disallowed | Disallowed | monitor-enabled | down | |
| Down / Forced Offline | Disabled / Forced Offline | Disallowed | Disallowed | user-disabled | down / user-down |
Conclusion
In this course, we reviewed how to determine the status of LTM objects such as Virtual Servers, Pools, Pool Members, and Nodes. You can quickly obtain an overview of all object statuses by using the Network Map page in the Configuration Utility.
We also examined how to interpret object status using their shape and color: the shape indicates the monitoring status, while the color reflects the administrative status.
Finally, we covered the difference between Disabled and Forced Offline states. A disabled object can still receive new connections if a persistence entry exists, while a forced offline object only allows existing connections to continue and rejects all new connections.